

OUR DAILY THREAD: The K-Shaped Society
It's getter harder to get a leg up

THE SET-UP: “K-shaped” is shaping-up to be the defining descriptor of the post-Pandemic economy.
Think of it as the new “Trickle-down.”
Like that iconic phrase, “K-shaped” may eventually say as much about the ethos of this era as it does about its economy. Oddly enough, the two may be bookends of a decades-long transformation from Demand to Supply Side economics. As the K-shaped recovery has hardened into the K-shaped economy, it appears that the supply side has reached a sort of critical mass in terms of hoarding capital and controlling assets. They have financial power and they live very comfortably in an inflationary economy. They can afford the affordability crisis.
That’s been showing up in retail sales. The National Retail Federation took note in an intro to a newly-released assessment of K-shaped retail spending:
Consumer spending has been one of the bright spots in this economy, but when you dig under the surface, not all segments of consumers are performing equally.
That’s something of an understatement. Their findings confirm one of the key indicators of the K-shaped economy: “the top 20% of spenders…accounted for over 60% of total spending” in 2025.
“Over 60%” is a significantly larger share than earlier assessments from other sources, which ranged between 40 and 50%. So, how did they arrive at that?
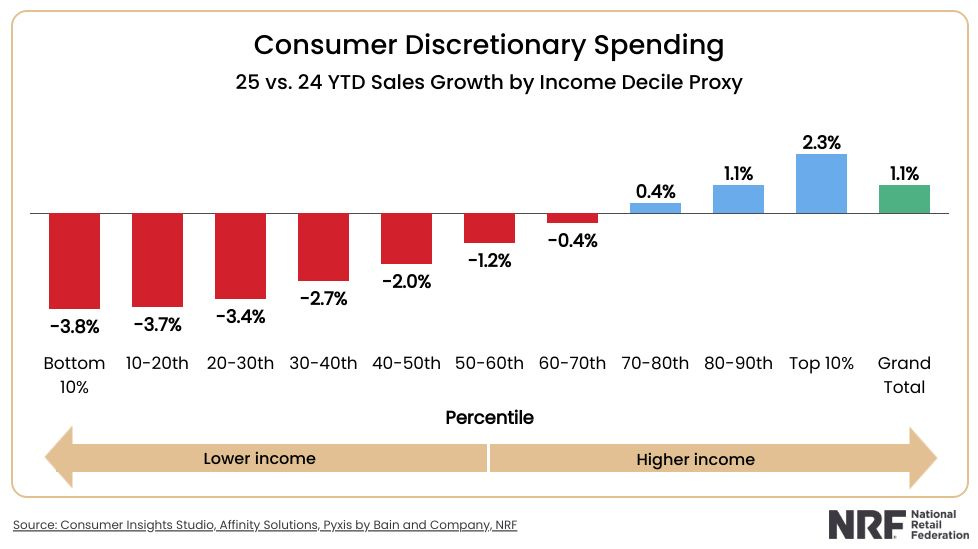
[W]e worked with our partners Pyxis by Bain & Company and Affinity Solutions to examine credit and debit card data and look for some clues. The data was broken down into spending deciles, which closely map to income levels. As illustrated in the chart below, you can see that there is a very real difference in spending growth in discretionary goods when you break it out by consumer spending levels.
I recommend visiting their web page to peruse the five additional charts that point to a growing bifurcation between those riding the upper arm of the K and those sliding down its leg. It’s as if two different economies exist side-by-side. But one of those economies is eclipsing the other. Here’s NRF’s Chief Economist:
What’s really notable is that, even though the bottom seven deciles saw negative growth in spending on discretionary items on a year-over-year basis, the grand total for all incomes was actually positive for the year. That’s because the top 20% of spenders in this category accounted for over 60% of total spending. Essentially, strong spending in higher income segments is masking weakness among lower income segments.
That “masking” effect is going to be a bigger problem the longer the arm and the leg continue to head in strikingly divergent directions. Unfortunately, the K’s ever-wealthier arm can single-handedly lift the entire economy in traditional metrics like gross domestic product and overall retail sales. The arm can hoard, generate and spend enough to both off-set and exceed the forced frugality of the leg. That not only “masks” the struggles of the bottom 80%, it ultimately eliminates them as a concern … particularly if growth in GDP hits 3, 4 or 5%!
Who in power will listen to complaints during 5% growth?
It hit 4.4% in Q3 of 2025, but that hasn’t translated into increased consumer confidence. At the same time, lower consumer confidence hasn’t dampened the market. The same is true of the dwindling job market and its continuing wave of layoffs.
The arm can afford to ignore the leg.
The economy enjoyed by the wealthy investors, corporate executives, highly-paid professionals and successful entrepreneurs has decoupled from the economy endured by the rest of us.
The demographics of this divide was the theme of the Kearney Institute’s newly-released Consumer Stress Index for the last quarter of 2025. Like RSF, it focuses on the K-shaped economy. More precisely, it dives deeply into the demographics:
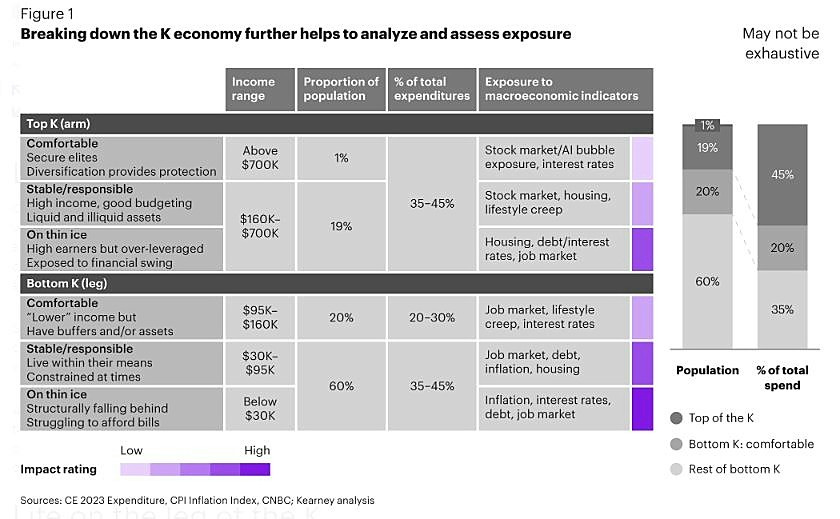
Here is how they describe “Life on the arm of the K”:
At the very top are “comfortable” individuals whose names and faces include those who regularly appear in the media with super-high incomes, traced back in some cases to beneficiaries of generational wealth and, in others, to success at the top of the tech boom who have amassed extreme wealth over the past 20 to 40 years.
Slightly below them, but still well above everyone else, we find the “stable/responsible,” consumers who are stable and getting by just fine. These are high-income individuals, who budget well, and perhaps live in lower cost of living (LCOL) areas.
At the bottom of the arm, dangling perilously close to the middle or leg of the K, we have the “on thin ice”—high earners whose lack of budgeting and profligate spending has them overleveraged and exposed. While they appear to be doing well from the outside, they are only a step away from real financial trouble.
And “Life on the leg of the K”:
Lower-income earners can also be divided into three segments, starting at the top of the “leg” with consumers who are “comfortable.” Their incomes technically put them in the bottom of the K, but their overall financial position is more secure on a day-to-day, year-to-year basis thanks to a variety of factors.
Next are those who are “stable/responsible,” relatively lower-income individuals who are constrained in their ability to spend but who have managed by choice and/or necessity to find ways to live within their means.
Toward the bottom of the leg, we find low- to no-income people who are truly “on thin ice.” These are folks struggling to pay their basic bills at the same time they are being crushed under a mountain of structural debt-promoting forces.
Kearney also noted:
Within these profiles often lie additional frustrations. For instance, many consumers on the leg of the K do not feel like they have benefited from economic growth in recent years, as they are often minimally invested in the stock market or major real estate holdings. Even when “net worth” looks good on paper, it’s often tied up in illiquid assets such as mortgages or retirement accounts, and is not being used to improve daily life.
That’s the thing about the K-shaped economy … it’s also the K-shaped society. And lifestyles are diverging, despite the All-American expectation that our lifestyle will continue to improve. Instead, the K portends a sharp decline in lifestyle for some time to come as the K is reinforced by the corporate world’s attempts to adjust and exploit the altered landscape. Take a look at these datapoints compiled this week by Empower Financial Services:
Many consumer-facing companies are seeing a divergence in spending among income groups. Delta Air Lines reported that revenue from premium seating was up 9% in the fourth quarter of 2025, while revenue for basic economy seating was down 7%. Premium seat sales are expected to exceed coach sales for 2026.19
Coca-Cola has seen higher-income earners drive sales growth among premium brands like Fairlife dairy, Topo Chico sparkling water, and protein beverages like Core Power. The company points to middle- and lower-income consumers being under pressure and seeking value.20
McDonald’s cited a “two-tier economy” and declining traffic among lower-income customers for a recent move to revive its “Extra Value Meal” combos.21 At the same time, there’s been a double-digit increase in higher-income customers, which McDonald’s says are also seeking value.22
A bifurcated trend has also developed among big-ticket purchases like autos, where the average price of new car has risen to $51,000. The share of new-car buyers with incomes of less than $100,000 has dropped to 37% from 50% in 2020. In contrast, car buyers with incomes of more than $200,000 has grown to 29% from 18% during that same period.23
Given the growing gap, those moves may just be the beginning:
Overall household debt hit a record high of $18.59 trillion the third quarter of 2025, according to data from the Federal Reserve Bank of New York, but the load isn’t always balanced.13 A 2025 study by the Federal Reserve Bank of Boston found credit card balances among lower-income households to be well above pre-pandemic levels — a notable divergence from higher-income households that carry less debt since that period.14
Housing tells a similar story. Equity in U.S. homes is near an all-time high of $35 trillion thanks to surging property values, with many Americans enjoying ultra-low mortgage rates below 4% or owning properties outright.15 Meanwhile, new and aspiring homeowners are grappling with elevated listing prices and mortgage rates. Many remain on the sidelines: The share of first-time buyers hit an all-time low of just 21% in 2025.16
The S&P 500® is up more than 130% since the onset of the pandemic in March 2020, another boost for higher-income households more likely to own stocks or retirement funds.17 Soaring AI-related stock valuations in particular have created a “wealth effect,” accounting for about $180 billion in consumer spending over the past year, according to one estimate.18
The most maddening part of this is AI’s “wealth effect.” That’s because the very thing that’s shaping this economy is also widely predicted to dislodge a significant number of those who are “on thin ice” in the shrinking middle. That will, of course, cascade down the K’s leg. And if AI is a bubble and it does burst, many of the people at the top-end of the K will not only survive it, they will likely retain enough purchasing power to once again go bargain shopping for discounted assets during the downturn. That, in turn, will further concentrate wealth and companies like Delta might fully exit the “downmarket,” leaving those passengers to flying cattle-cars like Spirit.
This, as Kearney aptly put it, is the K-shape of things to come:
At its simplest level, K economics suggests “the rich get richer while the poor get poorer.” When you look at the history of free-market capitalism, the K economy seems easily empirically verifiable…
Despite that, Kearney wouldn’t throw in the towel just yet. As they point out:
…all models are subject to disruption and interpretation, and this one is no exception.
And what’s the example given?
For example, the G.I. Bill of 1944 allowed legions of “leg consumers” to literally jump into the “arms” of the K.
It is indeed ironic that they cite one of Demand Side economics’ biggest successes. Legions of “leg consumers” used their new purchasing power (a.k.a. “demand”) to shape the economy of the 1950s. It was an economy that also sparked the modern conservative movement, which ultimately took control in 1980 and began to dismantle Demand Side economics and replace it with Milton Friedman’s neoliberal, Supply Side, Trickle-down “Reaganomics.”
Here’s hoping it doesn’t take a Great Depression and a World War to get a leg up again. - jp
Is retail spending really K-shaped?
https://nrf.com/blog/is-retail-spending-really-k-shaped
Hidden dimensions of the K-shaped economy: detailing how income, lifestyle, and circumstance shape consumer stress and spending
https://www.kearney.com/industry/consumer-retail/consumer-institute/stress-index/q4-2025-update
The K-shaped economy: What consumers should know
https://www.empower.com/the-currency/money/life/k-shaped-economy-what-to-know-news
Chipotle is targeting the top of the K-shaped economy
https://www.businessinsider.com/chipotle-price-changes-core-customer-shaped-economy-2026-2
America’s K-shaped economy has turned restaurant winners and losers upside down
https://www.businessinsider.com/america-k-shaped-economy-breaking-fast-food-playbook-2026-2