THE SET-UP: “The K-shaped Economy” is this year’s hottest take on the rapidly bifurcating fortunes of two distinct economic slopes on the K-shaped graph of household wealth. Since the end of the pandemic, the wealth and assets accumulated by the top 20% households are slanting sharply up … while the fortunes of the rest of us are slanting sharply down.
In other words, the economy doesn’t suck … it just sucks for you. More precisely, it sucks for many of us who live and work in the paycheck-to-paycheck economy.
If you’re cashing a paycheck, there’s a good chance that whatever gains you garnered over the last five-plus years are being gobbled-up at the grocery store and by utility bills and by servicing skyrocketing debt. If, though, you live in the investment economy, the AI-driven rise in your stock portfolio offers an exclusive opportunity to extract tax-free “income” with a Securities-Based Line of Credit (SBLOC). It’s kinda like a HELOC (Home Equity Line of Credit) against the gains generated by your shares in Apple, Nvidia and Alphabet (Google). Because it’s a loan, you don’t have to pay capital gains. And if you never sell your stocks, you can not only avoid capital gains, but you can also write-off the loan if you use those untaxed gains to fund more stock purchases.
That’s an extreme example of the rarified financial world occupied by the economy’s wealthiest winners, but I think it’s particularly illustrative of the K-shaped disparity. If you zoom out to the top 10% and 20% of households, you will find paycheck earners who probably pull six figures and enjoy watching their 401ks swell as the market hits another record high … which has happened seventeen times this year.
Those record highs are, according to President Trump, proof that the economy’s rising tide is lifting yachts, ski boats, jon boats, paddle boats and maybe even a few inner tubes. Frankly, it does make sense. When the market hits highs, it should trickle down to people who depend on paychecks. And it probably did when a rising Dow Jones Industrial Average meant more investible capital for General Electric, General Foods and General Motors. They’d probably use it to expand manufacturing, thereby creating more paychecks distributed to more workers in a growing economy.
But that’s not what’s happening.
Today, the Market’s main drivers are seven or eight tech companies banking on AI to do the opposite. If AI is successful, it will eliminate paychecks and, at the same time, extract more productivity from the paycheck earners who don’t lose their jobs to the AI revolution. Even at this early phase, the AI bubble is being used as an opportunity to cut jobs … perhaps because the Market loves it when job reductions are announced. It’s an easy avenue for quickly padding the bottom line for shareholders and further concentrating wealth in the hands of the supply side of the economy.
That’s the reality of the Market … it is a wealth hoarding machine. Here’s a useful breakdown from a CNBCstory published five days ago:
The top 1% owned half — or $25.6 trillion — of the total $51.2 trillion of corporate stock and mutual fund shares in the second quarter of 2025, according to the most recent Federal Reserve data. Meanwhile, the bottom 50% of households collectively held just 1% — or $540 billion — of that stock and mutual fund wealth.
The top 1% owns 50% and the bottom 50% owns 1%.
The symmetry is almost sublime. Zooming out a bit more is just as telling:
The top 20% wealthiest U.S. households own nearly 93% of all stock — meaning they get the lion’s share of any stock market gains, according to calculations by Edward Nathan Wolff, an economics professor at New York University who studies income and wealth distribution.
This is not a K-shaped bug. It is a feature of the Supply Side economics American voters ushered in when they elected Ronald Reagan in 1980. With him came the Neoliberalism of Milton Friedman and a long process of reorienting the economy away from Keynesian-style Demand Side economics.
Keynesian Demand Siders prefer to distribute capital to the demand side of the economy—with the government using policy and investment to generate employment (for example, through infrastructure spending) and, therefore, empowering paycheck-earning consumers to drive the economy through spending … a.k.a. through “demand.” The consumer is, in essence, an economic voter and the capital they spend informs and directs the market’s supply. To get there, Demand Siders tax wealth and regulate the market to manage capitalism’s excesses.
Supply Siders, on the other hand, reverses that engineering to put capital in the hands of the supply side of the economy. Milton Friedman and his Neoliberal acolytes (like Reagan), believed the supply side (investors) was far better equipped to direct economic growth. They minimize taxation and government spending to allow capital to pool in the hands of investors and finance and business. As capital accumulates on the supply side of the economy, it will (the theory says) create employment and distribute wealth, which either “trickles down” or lifts the dingy and the luxury catamaran at the same time.
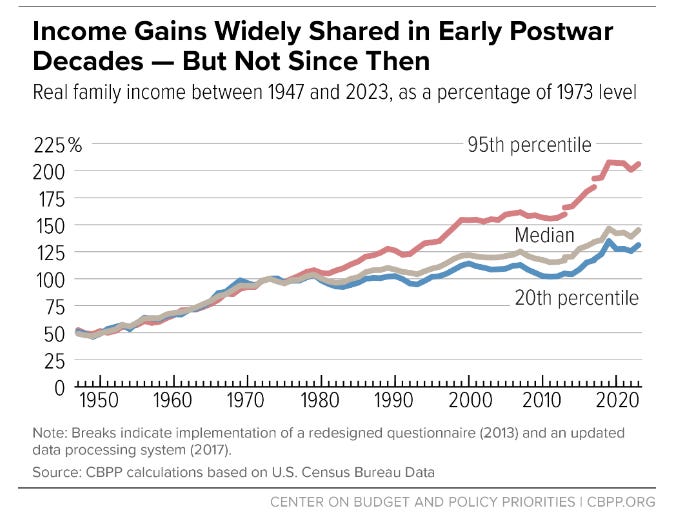
Here’s a chart that illustrates the before/after switch from Demand to Supply…
Up to 1980, most Americans were on the parallel tracks. Then Reagan took office and the economy starts to bifurcate into a nascent K-shape as the Demand Side Keynesianism of the New Deal is supplanted by Friedmanite Supply Side economics. The economy (and much of the capital) was placed in the hands of Wall Street investors instead of wage-earning consumers. Tom Wolfe called these financial elites the “Masters of the Universe.”
They acted accordingly.
They speculated. They borrowed. They dealt in junk bonds. They leveraged buyouts, raided corporations and parted ‘em out for profit. They ran the Savings & Loan scam.
They also moved manufacturing to cheaper labor in barely-regulated countries … which Wall Street usually rewarded with higher stock prices. In their growing absence, the physical economy of making things became the service economy of doing things … with people who once made things in factories relegated to doing things for people who can afford to not do those things themselves. The pruning of unions insured that the demand side couldn’t make as many economic or political demands. Consumers turned to credit cards to make up the difference between their income and their aspirations while debt was reimagined and packaged by Wall Street into saleable commodities.
Increasingly free from regulatory restrictions, capital-rich investors on the supply side further financialized the economy with a variety of exotic financial instruments. Traditional fundamentals like dividends and Price to Earning ratios were eclipsed by short-term bets and sudden cost-cutting measures to stoke stock prices. Speculation led to unsustainable excesses that led to predictable bubbles that, of course, popped. But busts turned out to be booms for those on the side with the supply. Crashes were just opportunities to hoard suddenly discounted assets … and that’s what the wealthy did throughout four decades of supply side-generated booms and busts.
Each excessive cycle jacked-up assets until the speculative scaffolding inevitably crashed. Investors who jacked-up the assets could expect to by bailed out by the same taxpayers who fell prey to each speculative bubble they blew.
It started with the corporate-raiding “barbarians at the gate,” junk bonds and the Crash of ‘87. The 90s started with the real estate scam of the Savings and Loan collapse and it ended with the 401k-fueled Dot Com Bubble. This century is still grappling with the engineered Crash of 2008. That crash may ultimately be seen as the culmination of a process that began in 1980. That’s due in no small part to the Fed’s multi-trillion dollar Quantitative Easing (QE) program.
But QE was much more than a bailout.
It not only allowed the supply side to gobble-up deflated assets while it also inflated stock prices and fueled buybacks. But that’s not all. It birthed a new species of company—the tech “Unicorn.” That’s a privately-held tech company with a valuation over $1 billion and it’s usually “pre-revenue.” Yup … Unicorns don’t make money. A lack of revenue didn’t impede their growth, though. Fundraising became the new revenue. Successive rounds of fundraising stoked valuations.
After 2008 there was a lot of capital available and it had a steroidal impact on tech valuations. Unicorns fed at the supply side’s trough. They burned though billions in venture capital investments on the pre-revenue “runway.” No matter, when they “go public,” the fear of missing out will generate massive stock sales and investors can exit with millions of dollars before the company is forced to turn a profit … or simply hold the stock and begin a lifetime of tax-free loans against their gains. Either way, it has allowed capital-rich venture capitalists and private equity firms to birth to a new class of supply side elites—surveillance capitalists.
Surveillance Capitalism may very well be the apotheosis of Supply Side economics. It has amassed Gilded Age-style wealth. It’s not coincidental that Trump is fixated on President McKinley and touts the Gilded Age as a golden age. It fuels his love of tariffs which, also not coincidentally, ultimately punishes the demand side of the economy.
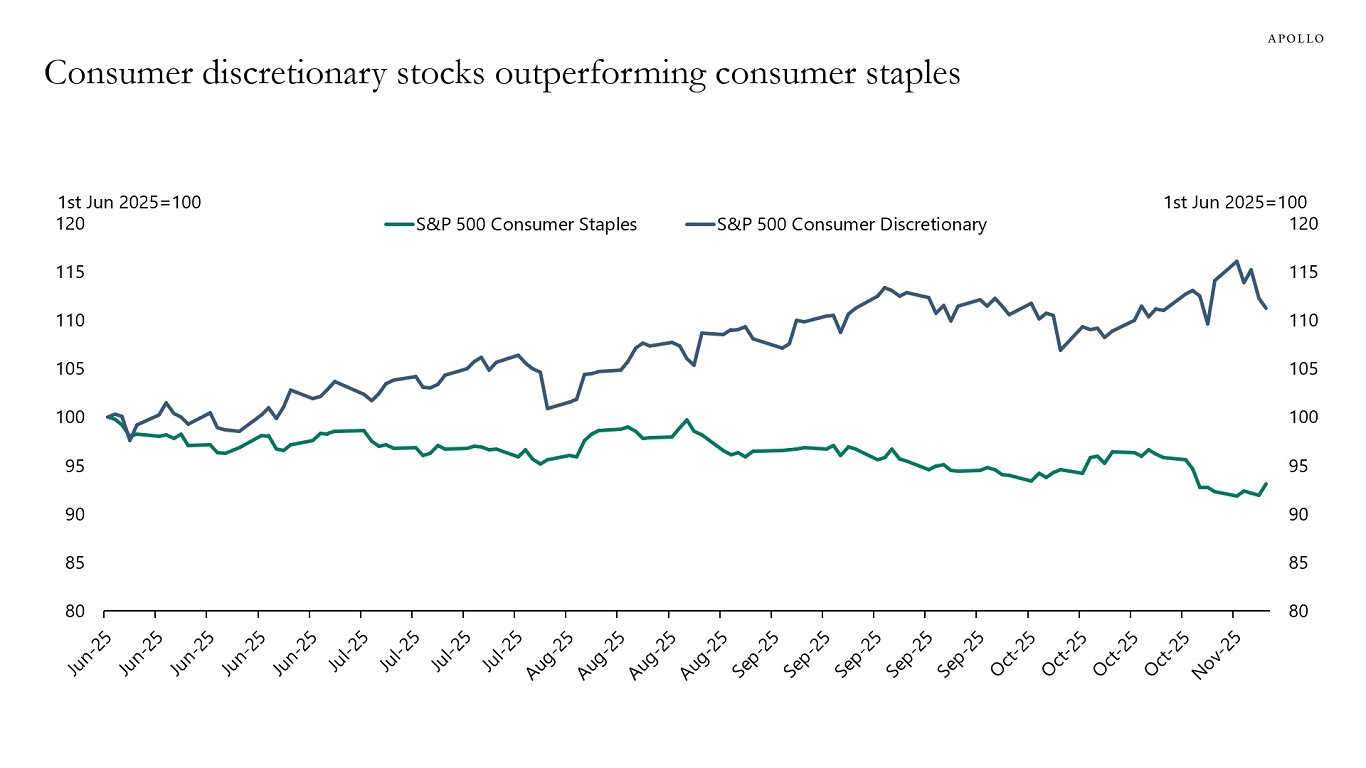
Actually, it only seems to impact consumers on the declining slope of the K-shaped economy. Here’s an excellent graph published today by Apollo Global Management’s Chief Economist Torsten Sløk:
Higher-income households have seen their stock holdings rise and their home prices increase. At the same time, the cash flow received in fixed income, including private credit, is near the highest levels in decades.
This strength of higher-income household balance sheets relative to lower-income balance sheets is the reason why consumer discretionary stocks in recent months have been outperforming consumer staples, see chart below.
Now, consumer spending is K-shaped.
Discretionary spending on things higher-income households want to buy … is doing just fine. And the stock prices of companies that cater to them are also doing just fine. But spending on things lower-income household need to buy? Not so much. Belts are tightening and it’s impacting the stocks of companies that serve the paycheck-to-paycheck earners who are losing ground each fiscal quarter since the end of covid.
Perhaps most alarming is an August assessment by Moody’s Analytics that, per Marketplace, found…
If you include the top 20% of earners, that number rises to 63%. As Axios pointed out, that means…
…[s]pending is being held up by the wealthy, while consumption from middle and lower income groups continues to fade.
Basically, the people at the top have accrued enough wealth to carry the retail economy. They can afford to buy things they want and, it stands to reason, they can absorb the additional cost of inflation and of Trump’s tariffs. They are on the rising slope of the K and they’ve literally got the receipts to prove it.
But what happens if the AI bubble pops and the lower half of the upper 20% cannot afford to buy-buy-buy? Will the top 10% make up the slack? Or will they also take a hit while the top 1% simply rides out the predictable turbulence they helped to create? They certainly can afford to absorb billions in stock losses … losses they can also write-off into wins while they prepare to partake in supply side’s final feeding frenzy. - jp
Rural America’s farm economy is struggling with its own K shape, as government payouts rocket to crisis levels https://fortune.com/2025/11/17/farm-economy-crisis-crop-prices-costs-government-payouts-trump-china-trade-war/
Federal Reserve Bank of New York… “outstanding credit‐card balances hit $1.23 trillion during the third quarter of 2025, roughly a 6% increase compared with the same quarter a year earlier.”
“Total household debt, which includes mortgages, auto loans, student loans and credit cards, reached about $18.59 trillion for the period from July to September, reflecting an increase of around $197 billion from the previous quarter.”